Front-End Performance 2021: Planning And Metrics

Email Newsletter
Weekly tips on front-end & UX.
Trusted by 200,000+ folks.
This guide has been kindly supported by our friends at LogRocket, a service that combines frontend performance monitoring, session replay, and product analytics to help you build better customer experiences. LogRocket tracks key metrics, incl. DOM complete, time to first byte, first input delay, client CPU and memory usage. Get a free trial of LogRocket today.
Table Of Contents
- Getting Ready: Planning And Metrics
Performance culture, Core Web Vitals, performance profiles, CrUX, Lighthouse, FID, TTI, CLS, devices. - Setting Realistic Goals
Performance budgets, performance goals, RAIL framework, 170KB/30KB budgets. - Defining The Environment
Choosing a framework, baseline performance cost, Webpack, dependencies, CDN, front-end architecture, CSR, SSR, CSR + SSR, static rendering, prerendering, PRPL pattern. - Assets Optimizations
Brotli, AVIF, WebP, responsive images, AV1, adaptive media loading, video compression, web fonts, Google fonts. - Build Optimizations
JavaScript modules, module/nomodule pattern, tree-shaking, code-splitting, scope-hoisting, Webpack, differential serving, web worker, WebAssembly, JavaScript bundles, React, SPA, partial hydration, import on interaction, 3rd-parties, cache. - Delivery Optimizations
Lazy loading, intersection observer, defer rendering and decoding, critical CSS, streaming, resource hints, layout shifts, service worker. - Networking, HTTP/2, HTTP/3
OCSP stapling, EV/DV certificates, packaging, IPv6, QUIC, HTTP/3. - Testing And Monitoring
Auditing workflow, proxy browsers, 404 page, GDPR cookie consent prompts, performance diagnostics CSS, accessibility. - Quick Wins
- Everything on one page
- Download The Checklist (PDF, Apple Pages, MS Word)
- Subscribe to our email newsletter to not miss the next guides.
Getting Ready: Planning And Metrics
Micro-optimizations are great for keeping performance on track, but it’s critical to have clearly defined targets in mind — measurable goals that would influence any decisions made throughout the process. There are a couple of different models, and the ones discussed below are quite opinionated — just make sure to set your own priorities early on.
- Establish a performance culture.
In many organizations, front-end developers know exactly what common underlying problems are and what strategies should be used to fix them. However, as long as there is no established endorsement of the performance culture, each decision will turn into a battlefield of departments, breaking up the organization into silos. You need a business stakeholder buy-in, and to get it, you need to establish a case study, or a proof of concept on how speed — especially Core Web Vitals which we'll cover in detail later — benefits metrics and Key Performance Indicators (KPIs) they care about.For example, to make performance more tangible, you could expose the revenue performance impact by showing the correlation between the conversion rate and time to application load, as well as rendering performance. Or the search bot crawling rate (PDF, pages 27–50).
Without a strong alignment between dev/design and business/marketing teams, performance isn’t going to sustain long-term. Study common complaints coming into customer service and sales team, study analytics for high bounce rates and conversion drops. Explore how improving performance can help relieve some of these common problems. Adjust the argument depending on the group of stakeholders you are speaking to.
Run performance experiments and measure outcomes — both on mobile and on desktop (for example, with Google Analytics). It will help you build up a company-tailored case study with real data. Furthermore, using data from case studies and experiments published on WPO Stats will help increase sensitivity for business about why performance matters, and what impact it has on user experience and business metrics. Stating that performance matters alone isn’t enough though — you also need to establish some measurable and trackable goals and observe them over time.
How to get there? In her talk on Building Performance for the Long Term, Allison McKnight shares a comprehensive case-study of how she helped establish a performance culture at Etsy (slides). More recently, Tammy Everts has spoken about habits of highly effective performance teams in both small and large organizations.
While having these conversations in organizations, it’s important to keep in mind that just like UX is a spectrum of experiences, web performance is a distribution. As Karolina Szczur noted, "expecting a single number to be able to provide a rating to aspire to is a flawed assumption." Hence performance goals need to be granular, trackable and tangible.
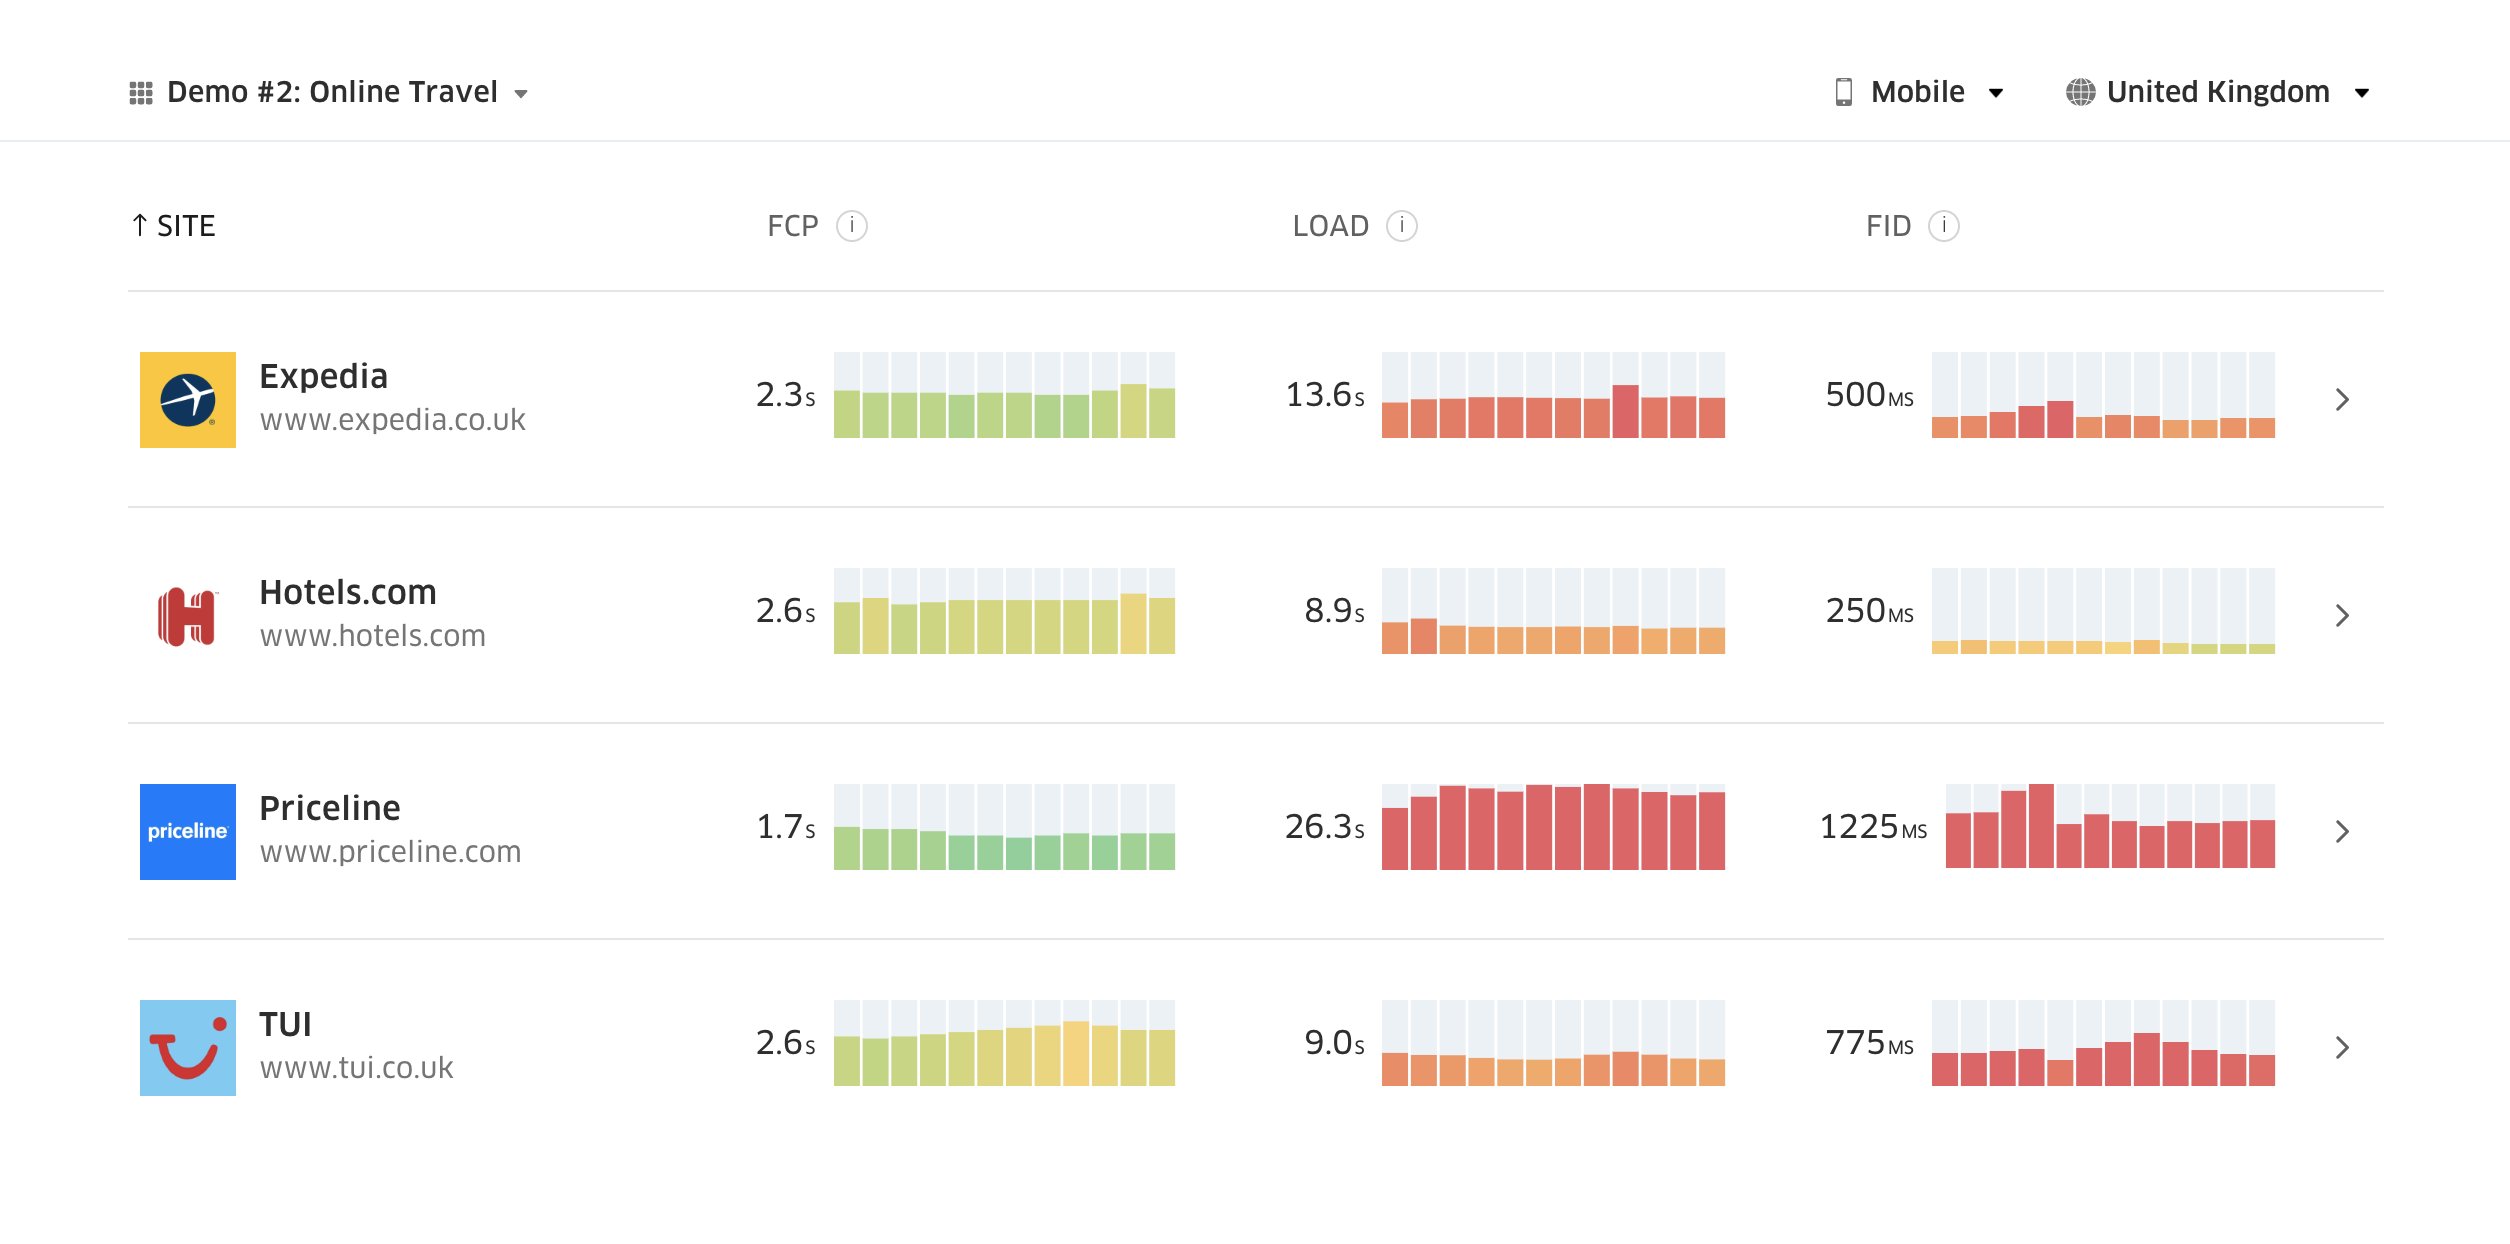
- Goal: Be at least 20% faster than your fastest competitor.
According to psychological research, if you want users to feel that your website is faster than your competitor’s website, you need to be at least 20% faster. Study your main competitors, collect metrics on how they perform on mobile and desktop and set thresholds that would help you outpace them. To get accurate results and goals though, make sure to first get a thorough picture of your users' experience by studying your analytics. You can then mimic the 90th percentile’s experience for testing.To get a good first impression of how your competitors perform, you can use Chrome UX Report (CrUX, a ready-made RUM data set, video introduction by Ilya Grigorik and detailed guide by Rick Viscomi), or Treo, a RUM monitoring tool that is powered by Chrome UX Report. The data is gathered from the Chrome browser users, so the reports will be Chrome-specific, but they will give you a fairly thorough distribution of performance, most importantly Core Web Vitals scores, across a wide range of your visitors. Note that new CrUX datasets are released on the second Tuesday of each month.
Alternatively, you can also use:
- Addy Osmani’s Chrome UX Report Compare Tool,
- Speed Scorecard (also provides a revenue impact estimator),
- Real User Experience Test Comparison or
- SiteSpeed CI (based on synthetic testing).
Note: If you use Page Speed Insights or Page Speed Insights API (no, it isn’t deprecated!), you can get CrUX performance data for specific pages instead of just the aggregates. This data can be much more useful for setting performance targets for assets like “landing page” or “product listing”. And if you are using CI to test the budgets, you need to make sure your tested environment matches CrUX if you used CrUX for setting the target (thanks Patrick Meenan!).
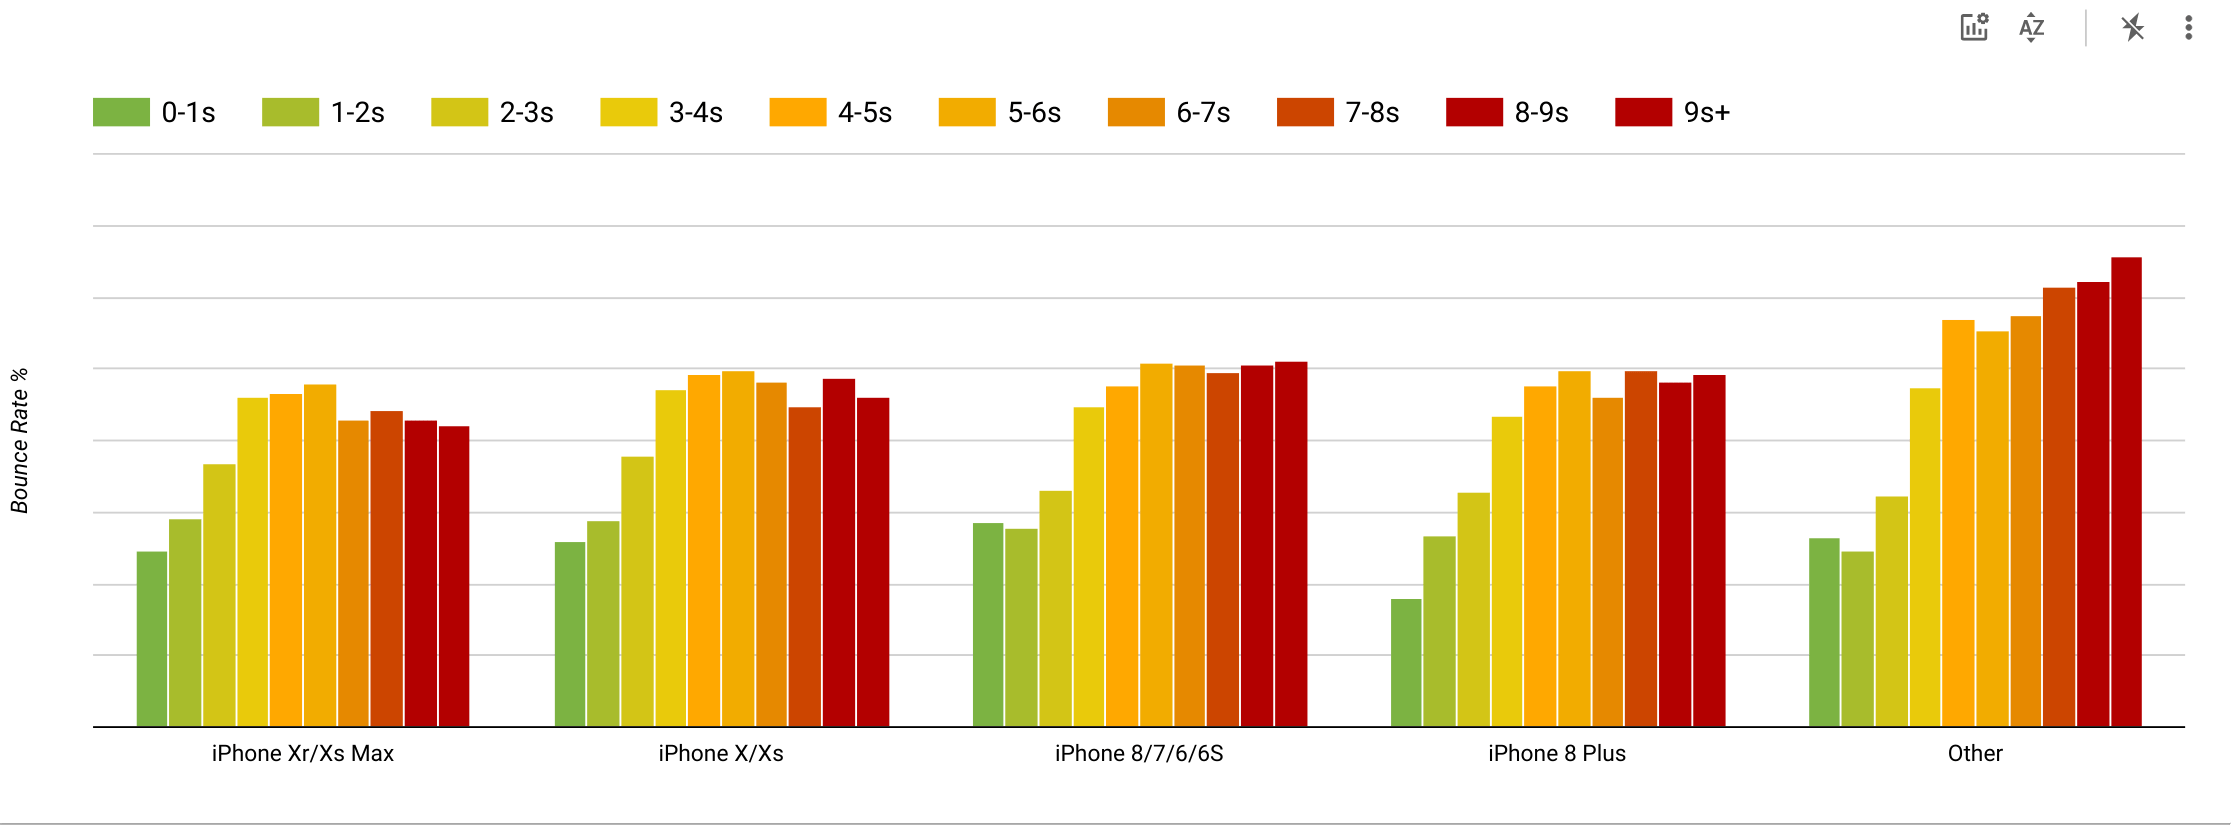
If you need some help to show the reasoning behind prioritization of speed, or you’d like to visualize conversion rate decay or increase in bounce rate with slower performance, or perhaps you’d need to advocate for a RUM solution in your organization, Sergey Chernyshev has built a UX Speed Calculator, an open-source tool that helps you simulate data and visualize it to drive your point across.
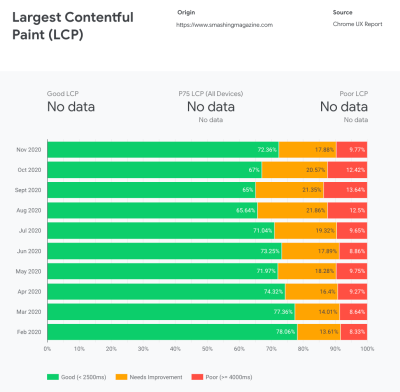
CrUX generates an overview of performance distributions over time, with traffic collected from Google Chrome users. You can create your own on Chrome UX Dashboard. (Large preview) 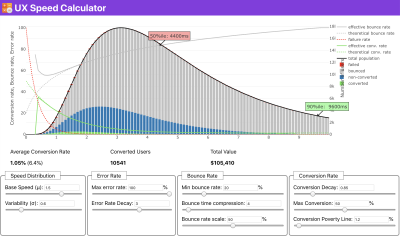
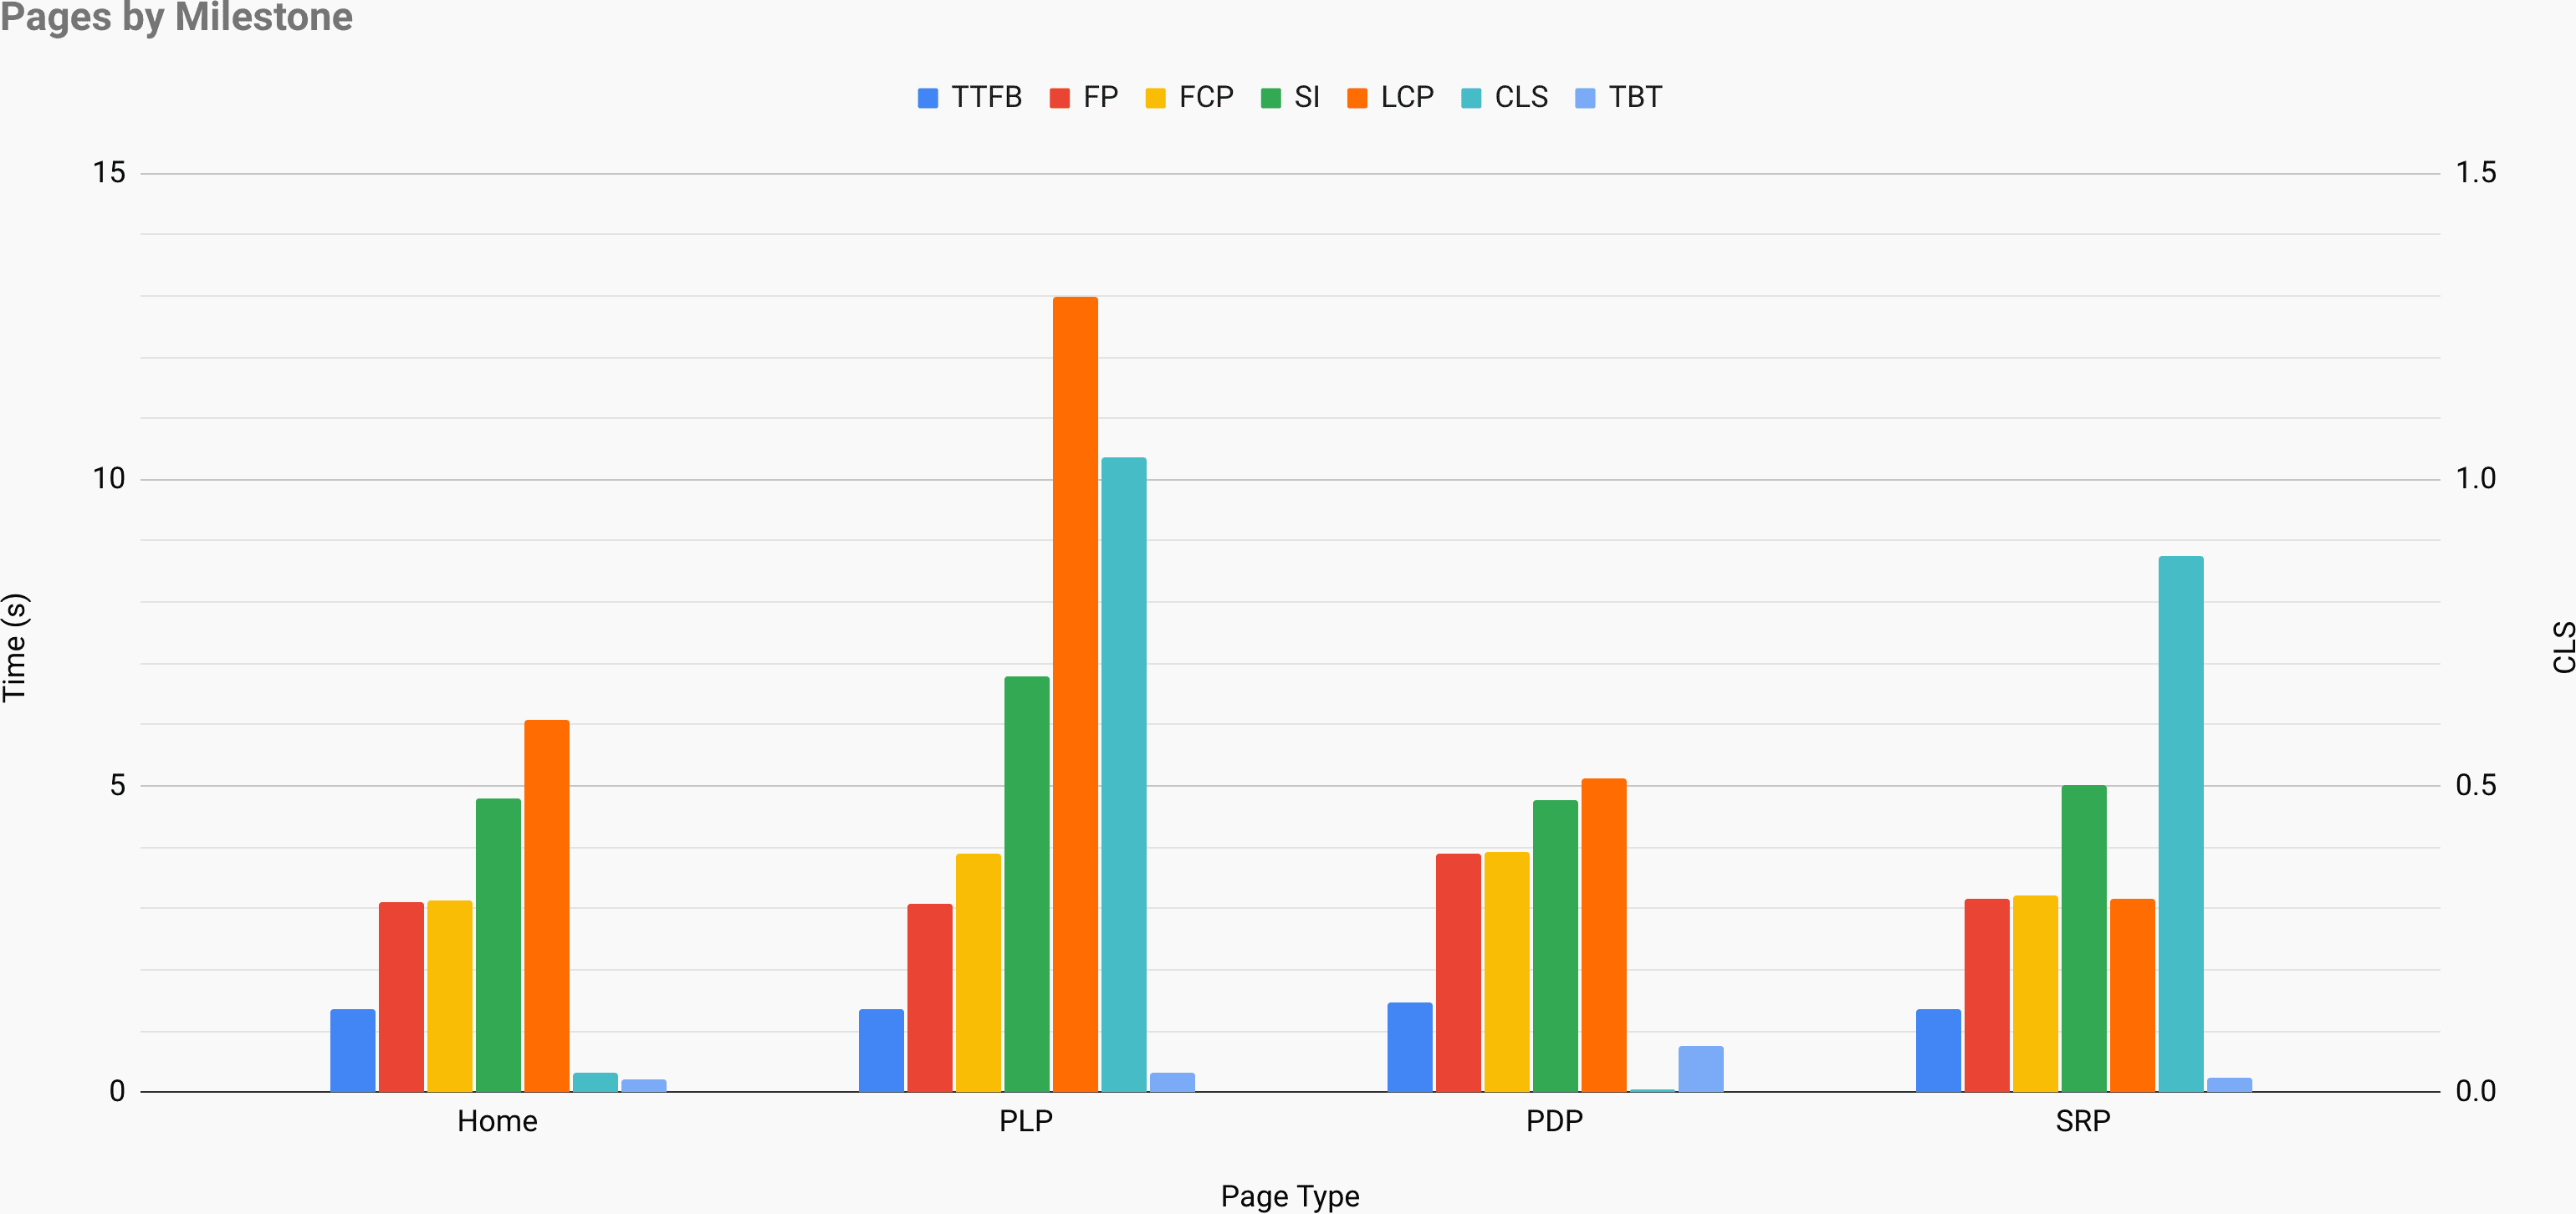
Just when you need to make a case for performance to drive your point across: UX Speed Calculator visualizes an impact of performance on bounce rates, conversion and total revenue — based on real data. (Large preview) Sometimes you might want to go a bit deeper, combining the data coming from CrUX with any other data you already have to work out quickly where the slowdowns, blindspots, and inefficiencies lie — for your competitors, or for your project. In his work, Harry Roberts has been using a Site-Speed Topography Spreadsheet which he uses to break down performance by key page types, and track how different key metrics are across them. You can download the spreadsheet as Google Sheets, Excel, OpenOffice document or CSV.

Site speed topography, with key metrics represented for key pages on the site. (Large preview) And if you want to go all the way, you can run a Lighthouse performance audit on every page of a site (via Lightouse Parade), with an output saved as CSV. That will help you identify which specific pages (or types of pages) of your competitors perform worse or better, and what you might want to focus your efforts on. (For your own site, it’s probably better to send data to an analytics endpoint though!).

With Lighthouse Parade, you can run a Lighthouse performance audit on every page of a site, with an output saved as CSV. (Large preview) Collect data, set up a spreadsheet, shave off 20%, and set up your goals (performance budgets) this way. Now you have something measurable to test against. If you’re keeping the budget in mind and trying to ship down just the minimal payload to get a quick time-to-interactive, then you’re on a reasonable path.
Need resources to get started?
- Addy Osmani has written a very detailed write-up on how to start performance budgeting, how to quantify the impact of new features and where to start when you are over budget.
- Lara Hogan’s guide on how to approach designs with a performance budget can provide helpful pointers to designers.
- Harry Roberts has published a guide on setting up a Google Sheet to display the impact of third-party scripts on performance, using Request Map,
- Jonathan Fielding’s Performance Budget Calculator, Katie Hempenius' perf-budget-calculator and Browser Calories can aid in creating budgets (thanks to Karolina Szczur for the heads up).
- In many companies, performance budgets shouldn’t be aspirational, but rather pragmatic, serving as a holding sign to avoid slipping past a certain point. In that case, you could pick your worst data point in the past two weeks as a threshold, and take it from there. Performance Budgets, Pragmatically shows you a strategy to achieve that.
- Also, make both performance budget and current performance visible by setting up dashboards with graphs reporting build sizes. There are many tools allowing you to achieve that: SiteSpeed.io dashboard (open source), SpeedCurve and Calibre are just a few of them, and you can find more tools on perf.rocks.

Browser Calories helps you set a performance budget and measure if a page is exceeding these numbers or not. (Large preview) Once you have a budget in place, incorporate them into your build process with Webpack Performance Hints and Bundlesize, Lighthouse CI, PWMetrics or Sitespeed CI to enforce budgets on pull requests and provide a score history in PR comments.
To expose performance budgets to the entire team, integrate performance budgets in Lighthouse via Lightwallet or use LHCI Action for quick Github Actions integration. And if you need something custom, you can use webpagetest-charts-api, an API of endpoints to build charts from WebPagetest results.
Performance awareness shouldn’t come from performance budgets alone though. Just like Pinterest, you could create a custom eslint rule that disallows importing from files and directories that are known to be dependency-heavy and would bloat the bundle. Set up a listing of “safe” packages that can be shared across the entire team.
Also, think about critical customer tasks that are most beneficial to your business. Study, discuss and define acceptable time thresholds for critical actions and establish "UX ready" user timing marks that the entire organization has approved. In many cases, user journeys will touch on the work of many different departments, so alignment in terms of acceptable timings will help support or prevent performance discussions down the road. Make sure that additional costs of added resources and features are visible and understood.
Align performance efforts with other tech initiatives, ranging from new features of the product being built to refactoring to reaching to new global audiences. So every time a conversation about further development happens, performance is a part of that conversation as well. It’s much easier to reach performance goals when the code base is fresh or is just being refactored.
Also, as Patrick Meenan suggested, it’s worth to plan out a loading sequence and trade-offs during the design process. If you prioritize early on which parts are more critical, and define the order in which they should appear, you will also know what can be delayed. Ideally, that order will also reflect the sequence of your CSS and JavaScript imports, so handling them during the build process will be easier. Also, consider what the visual experience should be in "in-between"-states, while the page is being loaded (e.g. when web fonts aren’t loaded yet).
Once you’ve established a strong performance culture in your organization, aim for being 20% faster than your former self to keep priorities in tact as time passes by (thanks, Guy Podjarny!). But account for the different types and usage behaviors of your customers (which Tobias Baldauf called cadence and cohorts), along with bot traffic and seasonality effects.
Planning, planning, planning. It might be tempting to get into some quick "low-hanging-fruits"-optimizations early on — and it might be a good strategy for quick wins — but it will be very hard to keep performance a priority without planning and setting realistic, company-tailored performance goals.


- Choose the right metrics.
Not all metrics are equally important. Study what metrics matter most to your application: usually, it will be defined by how fast you can start to render most important pixels of your interface and how quickly you can provide input responsiveness for these rendered pixels. This knowledge will give you the best optimization target for ongoing efforts. In the end, it’s not the load events or server response times that define the experience, but the perception of how snappy the interface feels.What does it mean? Rather than focusing on full page loading time (via onLoad and DOMContentLoaded timings, for example), prioritize page loading as perceived by your customers. That means focusing on a slightly different set of metrics. In fact, choosing the right metric is a process without obvious winners.
Based on Tim Kadlec’s research and Marcos Iglesias’ notes in his talk, traditional metrics could be grouped into a few sets. Usually, we’ll need all of them to get a complete picture of performance, and in your particular case some of them will be more important than others.
- Quantity-based metrics measure the number of requests, weight and a performance score. Good for raising alarms and monitoring changes over time, not so good for understanding user experience.
- Milestone metrics use states in the lifetime of the loading process, e.g. Time To First Byte and Time To Interactive. Good for describing the user experience and monitoring, not so good for knowing what happens between the milestones.
- Rendering metrics provide an estimate of how fast content renders (e.g. Start Render time, Speed Index). Good for measuring and tweaking rendering performance, but not so good for measuring when important content appears and can be interacted with.
- Custom metrics measure a particular, custom event for the user, e.g. Twitter’s Time To First Tweet and Pinterest’s PinnerWaitTime. Good for describing the user experience precisely, not so good for scaling the metrics and comparing with with competitors.
To complete the picture, we’d usually look out for useful metrics among all of these groups. Usually, the most specific and relevant ones are:
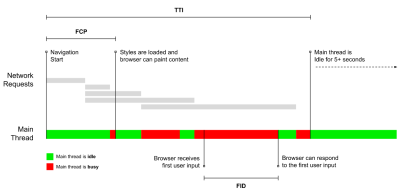
- Time to Interactive (TTI)
The point at which layout has stabilized, key webfonts are visible, and the main thread is available enough to handle user input — basically the time mark when a user can interact with the UI. The key metrics for understanding how much wait a user has to experience to use the site without a lag. Boris Schapira has written a detailed post on how to measure TTI reliably. - First Input Delay (FID), or Input responsiveness
The time from when a user first interacts with your site to the time when the browser is actually able to respond to that interaction. Complements TTI very well as it describes the missing part of the picture: what happens when a user actually interacts with the site. Intended as a RUM metric only. There is a JavaScript library for measuring FID in the browser. - Largest Contentful Paint (LCP)
Marks the point in the page load timeline when the page’s important content has likely loaded. The assumption is that the most important element of the page is the largest one visible in the user’s viewport. If elements are rendered both above and below the fold, only the visible part is considered relevant. - Total Blocking Time (TBT)
A metric that helps quantify the severity of how non-interactive a page is prior to it becoming reliably interactive (that is, the main thread has been free of any tasks running over 50ms (long tasks) for at least 5s). The metric measures the total amount of time between the first paint and Time to Interactive (TTI) where the main thread was blocked for long enough to prevent input responsiveness. No wonder, then, that a low TBT is a good indicator for good performance. (thanks, Artem, Phil) - Cumulative Layout Shift (CLS)
The metric highlights how often users experience unexpected layout shifts (reflows) when accessing the site. It examines unstable elements and their impact on the overall experience. The lower the score, the better. - Speed Index
Measures how quickly the page contents are visually populated; the lower the score, the better. The Speed Index score is computed based on the speed of visual progress, but it’s merely a computed value. It’s also sensitive to the viewport size, so you need to define a range of testing configurations that match your target audience. Note that it is becoming less important with LCP becoming a more relevant metric (thanks, Boris, Artem!). - CPU time spent
A metric that shows how often and how long the main thread is blocked, working on painting, rendering, scripting and loading. High CPU time is a clear indicator of a janky experience, i.e. when the user experiences a noticeable lag between their action and a response. With WebPageTest, you can select "Capture Dev Tools Timeline" on the "Chrome" tab to expose the breakdown of the main thread as it runs on any device using WebPageTest. - Component-Level CPU Costs
Just like with the CPU time spent, this metric, proposed by Stoyan Stefanov, explores the impact of JavaScript on CPU. The idea is to use CPU instruction count per component to understand its impact on the overall experience, in isolation. Could be implemented using Puppeteer and Chrome. - FrustrationIndex
While many metrics featured above explain when a particular event happens, Tim Vereecke’s FrustrationIndex looks at the gaps between metrics instead of looking at them individually. It looks at the key milestones perceived by the end-user, such as Title is visible, First content is visible, Visually ready and Page looks ready and calculates a score indicating the level of frustration while loading a page. The bigger the gap, the bigger the chance a user gets frustrated. Potentially a good KPI for user experience. Tim has published a detailed post about FrustrationIndex and how it works. - Ad Weight Impact
If your site depends on the revenue generated by advertising, it’s useful to track the weight of ad related code. Paddy Ganti’s script constructs two URLs (one normal and one blocking the ads), prompts the generation of a video comparison via WebPageTest and reports a delta. - Deviation metrics
As noted by Wikipedia engineers, data of how much variance exists in your results could inform you how reliable your instruments are, and how much attention you should pay to deviations and outlers. Large variance is an indicator of adjustments needed in the setup. It also helps understand if certain pages are more difficult to measure reliably, e.g. due to third-party scripts causing significant variation. It might also be a good idea to track browser version to understand bumps in performance when a new browser version is rolled out. - Custom metrics
Custom metrics are defined by your business needs and customer experience. It requires you to identify important pixels, critical scripts, necessary CSS and relevant assets and measure how quickly they get delivered to the user. For that one, you can monitor Hero Rendering Times, or use Performance API, marking particular timestamps for events that are important for your business. Also, you can collect custom metrics with WebPagetest by executing arbitrary JavaScript at the end of a test.
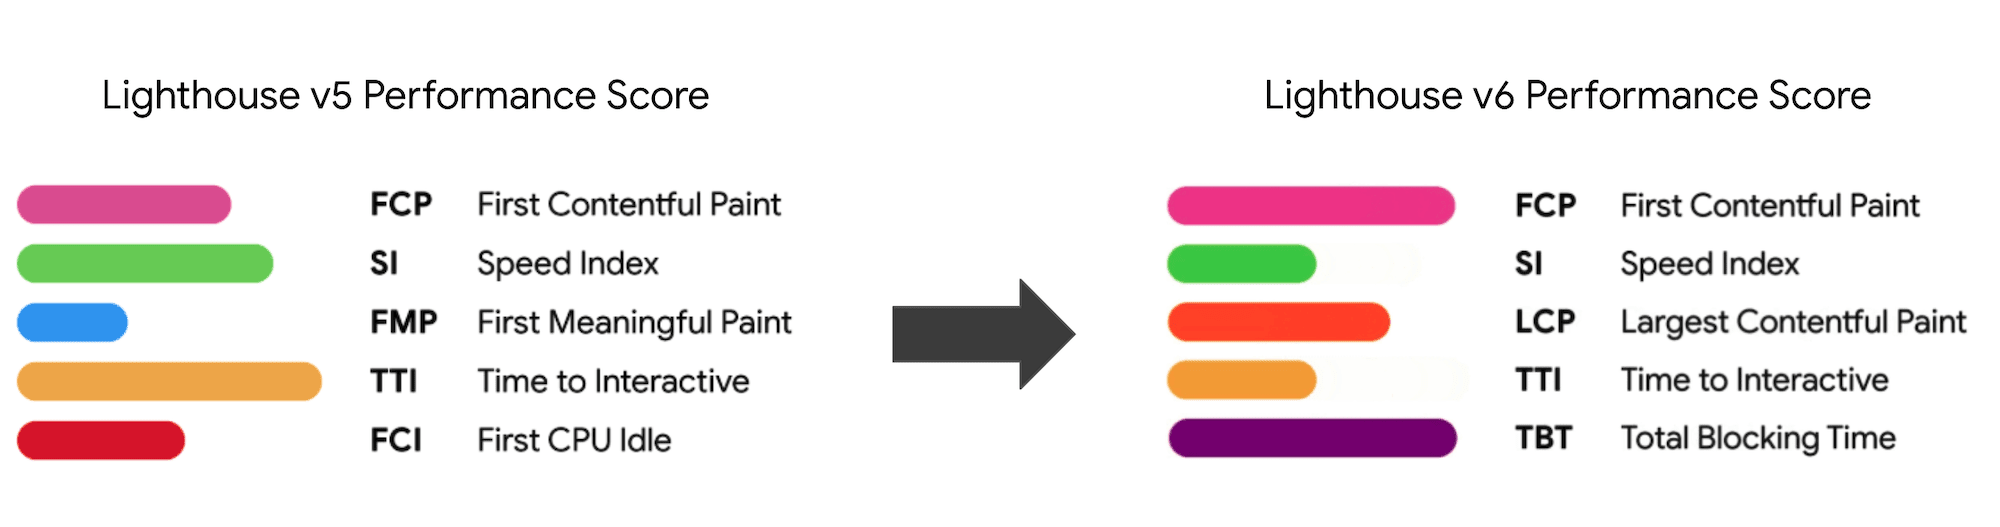
Note that the First Meaningful Paint (FMP) doesn’t appear in the overview above. It used to provide an insight into how quickly the server outputs any data. Long FMP usually indicated JavaScript blocking the main thread, but could be related to back-end/server issues as well. However, the metric has been deprecated recently as it appears not to be accurate in about 20% of the cases. It was effectively replaced with LCP which is both more reliable and easier to reason about. It is no longer supported in Lighthouse. Double check latest user-centric performance metrics and recommendations just to make sure you are on the safe page (thanks, Patrick Meenan).
Steve Souders has a detailed explanation of many of these metrics. It’s important to notice that while Time-To-Interactive is measured by running automated audits in the so-called lab environment, First Input Delay represents the actual user experience, with actual users experiencing a noticeable lag. In general, it’s probably a good idea to always measure and track both of them.
Depending on the context of your application, preferred metrics might differ: e.g. for Netflix TV UI, key input responsiveness, memory usage and TTI are more critical, and for Wikipedia, first/last visual changes and CPU time spent metrics are more important.
Note: both FID and TTI do not account for scrolling behavior; scrolling can happen independently since it’s off-main-thread, so for many content consumption sites these metrics might be much less important (thanks, Patrick!).
- Measure and optimize the Core Web Vitals.
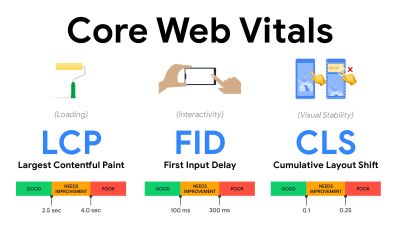
For a long time, performance metrics were quite technical, focusing on the engineering view of how fast servers are at responding, and how quick browsers are at loading. The metrics have changed over the years — attempting to find a way to capture the actual user experience, rather than server timings. In May 2020, Google has announced Core Web Vitals, a set of new user-focused performance metrics, each representing a distinct facet of the user experience.For each of them, Google recommends a range of acceptable speed goals. At least 75% of all page views should exceed the Good range to pass this assessment. These metrics quickly gained traction, and with Core Web Vitals becoming ranking signals for Google Search in May 2021 (Page Experience ranking algorithm update), many companies have turned their attention to their performance scores.
Let’s break down each of the Core Web Vitals, one by one, along with useful techniques and tooling to optimize your experiences with these metrics in mind. (It’s worth noting that you will end up with better Core Web Vitals scores by following a general advice in this article.)
- Largest Contentful Paint (LCP) < 2.5 sec.
Measures the loading of a page, and reports the render time of the largest image or text block that’s visible within the viewport. Hence, LCP is affected by everything that’s deferring the rendering of important information — be it slow server response times, blocking CSS, in-flight JavaScript (first-party or third-party), web font loading, expensive rendering or painting operations, lazy-loaded images, skeleton screens or client-side rendering.
For a good experience, LCP should occur within 2.5s of when the page first starts loading. That means that we need to render the first visible portion of the page as early as possible. That will require tailored critical CSS for each template, orchestrating the ``-order and prefetching critical assets (we’ll cover them later).The main reason for a low LCP score is usually images. To deliver an LCP in <2.5s on Fast 3G — hosted on a well-optimized server, all static without client-side rendering and with an image coming from a dedicated image CDN — means that the maximum theoretical image size is only around 144KB. That’s why responsive images matter, as well as preloading critical images early (with
preload).Quick tip: to discover what is considered LCP on a page, in DevTools you can hover over the LCP badge under "Timings" in the Performance Panel (thanks, Tim Kadlec!).
- First Input Delay (FID) < 100ms.
Measures the responsiveness of the UI, i.e. how long the browser was busy with other tasks before it could react to a discrete user input event like a tap, or a click. It’s designed to capture delays that result from the main thread being busy, especially during page load.
The goal is to stay within 50–100ms for every interaction. To get there, we need to identify long tasks (blocks the main thread for >50ms) and break them up, code-split a bundle into multiple chunks, reduce JavaScript execution time, optimize data-fetching, defer script execution of third-parties, move JavaScript to the background thread with Web workers and use progressive hydration to reduce rehydration costs in SPAs.Quick tip: in general, a reliable strategy to get a better FID score is to minimize the work on the main thread by breaking larger bundles into smaller ones and serving what the user needs when they need it, so user interactions won’t be delayed. We’ll cover more on that in detail below.
- Cumulative Layout Shift (CLS) < 0.1.
Measures visual stability of the UI to ensure smooth and natural interactions, i.e. the sum total of all individual layout shift scores for every unexpected layout shift that occurs during the lifespan of the page. An individual layout shift occurs any time an element which was already visible changes its position on the page. It’s scored based on the size of the content and distance it moved.
So every time a shift appears — e.g. when fallback fonts and web fonts have different font metrics, or adverts, embeds or iframes coming in late, or image/video dimensions aren’t reserved, or late CSS forces repaints, or changes are injected by late JavaScript — it has an impact on the CLS score. The recommended value for a good experience is a CLS < 0.1.
It’s worth noting that Core Web Vitals are supposed to evolve over time, with a predictable annual cycle. For the first year update, we might be expecting First Contentful Paint to be promoted to Core Web Vitals, a reduced FID threshold and better support for single-page applications. We might also see the responding to user inputs after load gaining more weight, along with security, privacy and accessibility (!) considerations.
Related to Core Web Vitals, there are plenty of useful resources and articles that are worth looking into:
- Web Vitals Leaderboard allows you to compare your scores against competition on mobile, tablet, desktop, and on 3G and 4G.
- Core SERP Vitals, a Chrome extension that shows the Core Web Vitals from CrUX in the Google Search Results.
- Layout Shift GIF Generator that visualizes CLS with a simple GIF (also available from the command line).
- web-vitals library can collect and send Core Web Vitals to Google Analytics, Google Tag Manager or any other analytics endpoint.
- Analyzing Web Vitals with WebPageTest, in which Patrick Meenan explores how WebPageTest exposes data about Core Web Vitals.
- Optimizing with Core Web Vitals, a 50-min video with Addy Osmani, in which he highlights how to improve Core Web Vitals in an eCommerce case-study.
- Cumulative Layout Shift in Practice and Cumulative Layout Shift in the Real World are comprehensive articles by Nic Jansma, which cover pretty much everything about CLS and how it correlates with key metrics such as Bounce Rate, Session Time or Rage Clicks.
- What Forces Reflow, with an overview of properties or methods, when requested/called in JavaScript, that will trigger the browser to synchronously calculate the style and layout.
- CSS Triggers shows which CSS properties trigger Layout, Paint and Composite.
- Fixing Layout Instability is a walkthrough of using WebPageTest to identify and fix layout instability issues.
- Cumulative Layout Shift, The Layout Instability Metric, another very detailed guide by Boris Schapira on CLS, how it’s calcualted, how to measure and how to optimize for it.
- How To Improve Core Web Vitals, a detailed guide by Simon Hearne on each of the metrics (including other Web Vitals, such as FCP, TTI, TBT), when they occur and how they are measured.
So, are Core Web Vitals the ultimate metrics to follow? Not quite. They are indeed exposed in most RUM solutions and platforms already, including Cloudflare, Treo, SpeedCurve, Calibre, WebPageTest (in the filmstrip view already), Newrelic, Shopify, Next.js, all Google tools (PageSpeed Insights, Lighthouse + CI, Search Console etc.) and many others.
However, as Katie Sylor-Miller explains, some of the main problems with Core Web Vitals are the lack of cross-browser support, we don’t really measure the full lifecycle of a user’s experience, plus it’s difficult to correlate changes in FID and CLS with business outcomes.
As we should be expecting Core Web Vitals to evolve, it seems only reasonable to always combine Web Vitals with your custom-tailored metrics to get a better understanding of where you stand in terms of performance.
- Largest Contentful Paint (LCP) < 2.5 sec.
- Gather data on a device representative of your audience.
To gather accurate data, we need to thoroughly choose devices to test on. In most companies, that means looking into analytics and creating user profiles based on most common device types. Yet often, analytics alone doesn’t provide a complete picture. A significant portion of the target audience might be abandoning the site (and not returning back) just because their experience is too slow, and their devices are unlikely to show up as the most popular devices in analytics for that reason. So, additionally conducting research on common devices in your target group might be a good idea.Globally in 2020, according to the IDC, 84.8% of all shipped mobile phones are Android devices. An average consumer upgrades their phone every 2 years, and in the US phone replacement cycle is 33 months. Average bestselling phones around the world will cost under $200.
A representative device, then, is an Android device that is at least 24 months old, costing $200 or less, running on slow 3G, 400ms RTT and 400kbps transfer, just to be slightly more pessimistic. This might be very different for your company, of course, but that’s a close enough approximation of a majority of customers out there. In fact, it might be a good idea to look into current Amazon Best Sellers for your target market. (Thanks to Tim Kadlec, Henri Helvetica and Alex Russell for the pointers!).

When building a new site or app, always check current Amazon Best Sellers for your target market first. (Large preview) What test devices to choose then? The ones that fit well with the profile outlined above. It’s a good option to choose a slightly older Moto G4/G5 Plus, a mid-range Samsung device (Galaxy A50, S8), a good middle-of-the-road device like a Nexus 5X, Xiaomi Mi A3 or Xiaomi Redmi Note 7 and a slow device like Alcatel 1X or Cubot X19, perhaps in an open device lab. For testing on slower thermal-throttled devices, you could also get a Nexus 4, which costs just around $100.
Also, check the chipsets used in each device and do not over-represent one chipset: a few generations of Snapdragon and Apple as well as low-end Rockchip, Mediatek would be enough (thanks, Patrick!).
If you don’t have a device at hand, emulate mobile experience on desktop by testing on a throttled 3G network (e.g. 300ms RTT, 1.6 Mbps down, 0.8 Mbps up) with a throttled CPU (5× slowdown). Eventually switch over to regular 3G, slow 4G (e.g. 170ms RTT, 9 Mbps down, 9Mbps up), and Wi-Fi. To make the performance impact more visible, you could even introduce 2G Tuesdays or set up a throttled 3G/4G network in your office for faster testing.
Keep in mind that on a mobile device, we should be expecting a 4×–5× slowdown compared to desktop machines. Mobile devices have different GPUs, CPU, memory and different battery characteristics. That’s why it’s important to have a good profile of an average device and always test on such a device.
- Synthetic testing tools collect lab data in a reproducible environment with predefined device and network settings (e.g. Lighthouse, Calibre, WebPageTest) and
- Real User Monitoring (RUM) tools evaluate user interactions continuously and collect field data (e.g. SpeedCurve, New Relic — the tools provide synthetic testing, too).
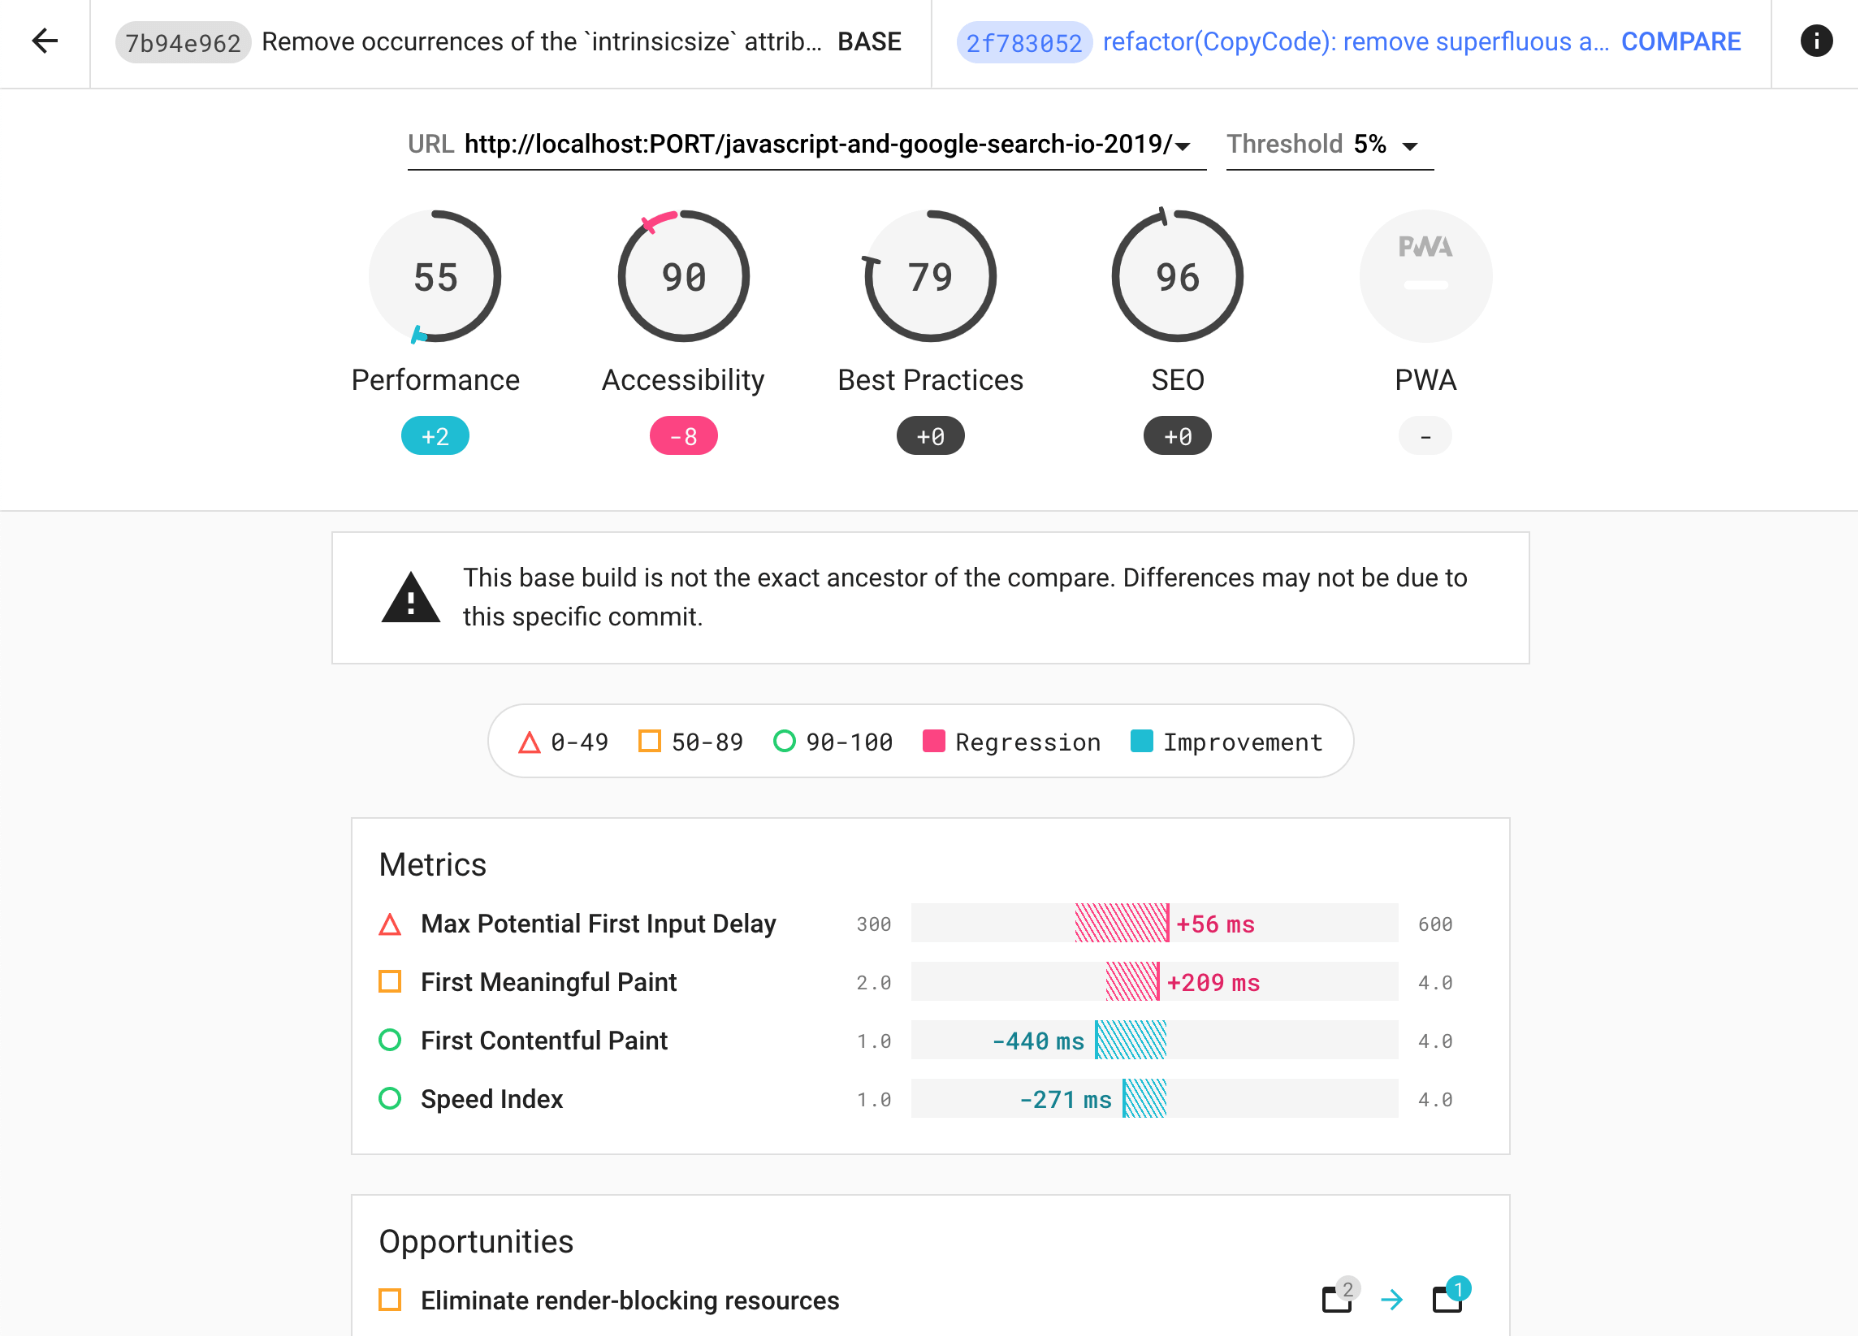
- use Lighthouse CI to track Lighthouse scores over time (it’s quite impressive),
- run Lighthouse in GitHub Actions to get a Lighthouse report alongside every PR,
- run a Lighthouse performance audit on every page of a site (via Lightouse Parade), with an output saved as CSV,
- use Lighthouse Scores Calculator and Lighthouse metric weights if you need to dive into more detail.
- Lighthouse is available for Firefox as well, but under the hood it uses the PageSpeed Insights API and generates a report based on a headless Chrome 79 User-Agent.


Luckily, there are many great options that help you automate the collection of data and measure how your website performs over time according to these metrics. Keep in mind that a good performance picture covers a set of performance metrics, lab data and field data:
The former is particularly useful during development as it will help you identify, isolate and fix performance issues while working on the product. The latter is useful for long-term maintenance as it will help you understand your performance bottlenecks as they are happening live — when users actually access the site.
By tapping into built-in RUM APIs such as Navigation Timing, Resource Timing, Paint Timing, Long Tasks, etc., synthetic testing tools and RUM together provide a complete picture of performance in your application. You could use Calibre, Treo, SpeedCurve, mPulse and Boomerang, Sitespeed.io, which all are great options for performance monitoring. Furthermore, with Server Timing header, you could even monitor back-end and front-end performance all in one place.
Note: It’s always a safer bet to choose network-level throttlers, external to the browser, as, for example, DevTools has issues interacting with HTTP/2 push, due to the way it’s implemented (thanks, Yoav, Patrick!). For Mac OS, we can use Network Link Conditioner, for Windows Windows Traffic Shaper, for Linux netem, and for FreeBSD dummynet.
As it’s likely that you’ll be testing in Lighthouse, keep in mind that you can:
- Set up "clean" and "customer" profiles for testing.
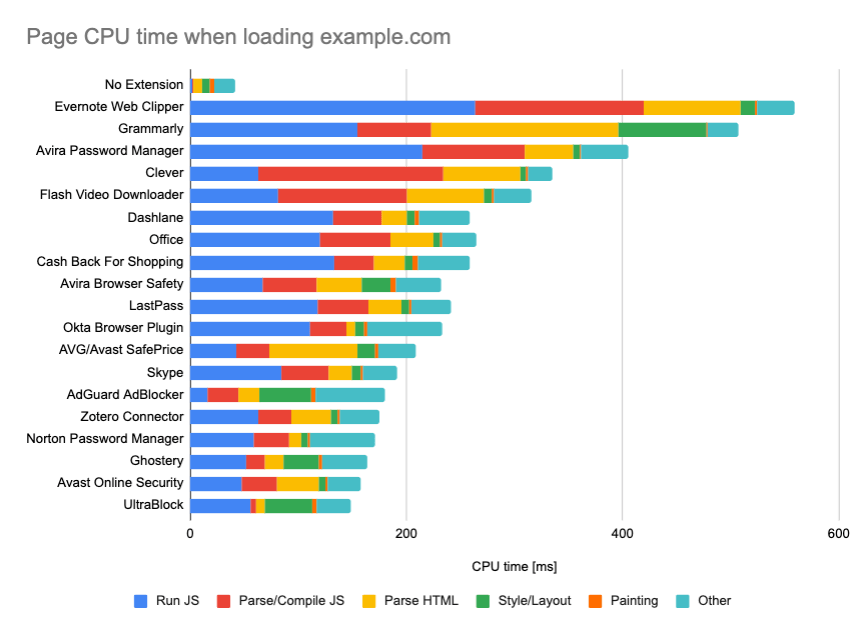
While running tests in passive monitoring tools, it’s a common strategy to turn off anti-virus and background CPU tasks, remove background bandwidth transfers and test with a clean user profile without browser extensions to avoid skewed results (in Firefox, and in Chrome).
DebugBear’s report highlights 20 slowest extensions, including password managers, ad-blockers and popular applications like Evernote and Grammarly. (Large preview) However, it’s also a good idea to study which browser extensions your customers use frequently, and test with dedicated "customer" profiles as well. In fact, some extensions might have a profound performance impact (2020 Chrome Extension Performance Report) on your application, and if your users use them a lot, you might want to account for it up front. Hence, "clean" profile results alone are overly optimistic and can be crushed in real-life scenarios.
- Share the performance goals with your colleagues.
Make sure that performance goals are familiar to every member of your team to avoid misunderstandings down the line. Every decision — be it design, marketing or anything in-between — has performance implications, and distributing responsibility and ownership across the entire team would streamline performance-focused decisions later on. Map design decisions against performance budget and the priorities defined early on.
Table Of Contents
- Getting Ready: Planning And Metrics
- Setting Realistic Goals
- Defining The Environment
- Assets Optimizations
- Build Optimizations
- Delivery Optimizations
- Networking, HTTP/2, HTTP/3
- Testing And Monitoring
- Quick Wins
- Everything on one page
- Download The Checklist (PDF, Apple Pages, MS Word)
- Subscribe to our email newsletter to not miss the next guides.